How I reverse-engineered Emby’s undocumented channel mapping API — and what it revealed about who actually controls your electronic program guide.

Your TV guide isn’t free. It never was. The schedule data that tells your media server what’s on HBO at 9pm — the show titles, episode descriptions, cast lists, thumbnail artwork — all of it flows from a single company called Gracenote, now owned by Nielsen. They license that data to cable operators, streaming platforms, and hardware manufacturers. It’s one of the quieter monopolies in media, and it sits underneath almost every TV experience you’ve ever had.
Today, if you run a self-hosted media setup — Emby, Jellyfin, Plex — you’re living at the intersection of Gracenote’s paid licensing infrastructure, a patchwork of “open source” XMLTV metadata feeds of varying quality, and M3U playlist files that third-party IPTV services use to deliver streams. Most people running this kind of setup never fully connect those three layers. They install xteve, point it at an M3U, add an EPG source, and wonder why their guide is broken or showing the wrong shows.
“The schedule data that tells your media server what’s on HBO flows from a single company. It’s one of the quieter monopolies in media.”
I spent a Saturday trying to fix a guide mapping problem that turned into a four-hour reverse-engineering session. What I found explains a lot about how this whole ecosystem actually works — and why automating something that should be simple turned out to require reading a SQLite database directly.
The Three-Layer Problem
When you watch live TV through a self-hosted setup, guide data travels through three distinct layers before it reaches your screen — and most people have no idea all three exist simultaneously.
Layer 1 — The Stream
Your M3U file is just a playlist. It contains channel names, stream URLs, and metadata tags like tvg-id and tvg-name. Those tags are hints — they tell downstream tools what channel this stream is supposed to be. They’re set by whoever packaged your M3U and may or may not match any standard naming convention.
Layer 2 — The Proxy (Threadfin/xTeVe)
Threadfin sits between your M3U source and your media server. It ingests the M3U, merges it with an XMLTV EPG source, and presents the result to Emby as a fake HDHomeRun tuner. This is where the first mapping happens: M3U channel → XMLTV channel ID. If your M3U’s tvg-id values don’t match the XMLTV source’s channel IDs, every channel falls back to a dummy mapping. In my case, that dummy happened to be Fox News for every single channel — a memorable failure mode.
Layer 3 — The Media Server Guide Provider
Even after Threadfin is working correctly and serving XMLTV data to Emby, there’s a second mapping layer inside Emby itself. Emby can be told to ignore the XMLTV guide for a channel and instead pull that channel’s schedule from Emby Guide Data — which is Gracenote. Better cast info, episode metadata, artwork thumbnails. This is what Emby Premiere subscribers pay for. And this second mapping — M3U channel → Emby Guide Data channel — is what has to be done manually, one channel at a time, through the UI.
The StackM3U playlist → Threadfin proxy → Emby Live TV → Emby Guide Data (Gracenote). Each arrow is a mapping that can break. Most people are only aware of one or two of them.
The Starting Point: A Busted xepg.db
My setup had just migrated from a Synology NAS to a UGREEN DXP8800 Plus. When Threadfin was reinstalled on the new machine, it got a new M3U provider ID — a long random string that acts as the internal identifier for the playlist source. The old database I’d carried over still referenced the old ID, so every channel mapping was broken. The first fix was a Python script to repair the Threadfin channel database in bulk.
fix_threadfin_epg.py
# For each channel stuck on "Threadfin Dummy" with a real tvg-id,
# set the XMLTV file to our EPG source and mapping to the channel's own tvg-id.

for key, channel in data.items():
    tvg_id = channel.get("tvg-id", "")

    # Threadfin-generated hash = no real EPG match, leave as Dummy
    if tvg_id.startswith("threadfin-") or not tvg_id:
        continue

    # Fix: use the channel's own tvg-id as the XMLTV mapping
    channel["x-xmltv-file"] = "XOZV46TSNTVT0SEW8V2Y.xml"
    channel["x-mapping"] = tvg_id
    fixed += 1
The old Synology M3U ID also needed to be swapped throughout the database. A single sed command handled that:
Terminal — UGREEN NAS
root@DXP8800PLUS:~# sed -i 's/M0XZX9Q4ZLB22IFARL7C/MOIO93S0PEAB35S3BFBZ/g' xepg.db
37 channels remapped to epg.iptv.cat
8 channels left on Dummy (local affiliates, no tvg-id match)
The API That Lies
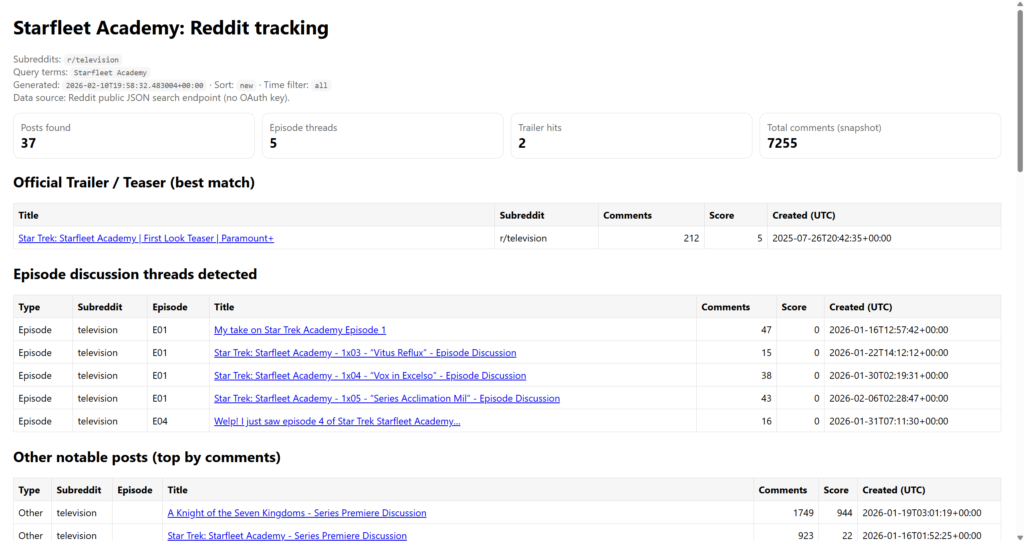
With Threadfin fixed, the XMLTV guide was working. But I wanted Gracenote data — the full Emby Guide Data experience — for as many channels as possible. The logical path was Emby’s channel mapping API. There’s an endpoint called /emby/LiveTv/ChannelMappingOptions that is documented as returning tuner channels alongside provider channels for matching.
For M3U sources, it returns an empty array for tuner channels. Every time. This is not documented anywhere. The endpoint works correctly for hardware tuners like HDHomeRun, but silently fails for M3U — which is how the vast majority of IPTV users have their channels configured.
emby_channel_update.py — Script 2 of 9
# GET /emby/LiveTv/ChannelMappingOptions?ProviderId={nj_provider_id}
nj_opts = api_get(f"/emby/LiveTv/ChannelMappingOptions?ProviderId={PROVIDER_NJ}")

print(f"TunerChannels: {len(nj_opts.get('TunerChannels', []))}")
# Output: TunerChannels: 0
# Dead end. The API genuinely returns nothing for M3U sources.
The next seven scripts were a systematic elimination of every possible API path to get the field I needed — a value called ManagementId that Emby uses internally as the tunerChannelId in channel mapping POST requests. I could see it in browser dev tools when manually saving a channel. I couldn’t get it from any API endpoint.
10.1.10.114:8096/web/index.html#!/livetv — Network Tab
POST /emby/LiveTv/ChannelMappings 200 OK Request Payload: { “providerId”: “1c0742ba56084f7896d8ea10892a1a7a”, “tunerChannelId”: “f9756a2952bb48888b8498e02473b36a_m3u_4390f9d…c8a75b_5”, “providerChannelId”: “11746” } — ManagementId visible in browser, NOT exposed by any API endpoint —
Nine Scripts to Find One Field
The diagnostic process was methodical. Each script tested a hypothesis, hit a wall, and revealed the next thing to try.
| # | Script | Hypothesis | Result |
|---|---|---|---|
| 1 | fix_threadfin_epg.py | Threadfin xepg.db can be bulk-fixed | ✓ Success |
| 2 | emby_channel_update.py | ChannelMappingOptions returns tuner channels | ✗ TunerChannels=0 |
| 3 | emby_full_mapper.py | ManagementId in /LiveTv/Channels/{id} | ✗ Field stripped |
| 4 | emby_check_fields.py | Browser headers unlock /Items/{id} | ✗ 404 for all channels |
| 5 | Hash test (inline) | Hash derivable from stream URL or tuner ID | ✗ Algorithm unknown |
| 6 | emby_get_mgmt_ids.py | ShareLevel field param exposes ManagementId | ✗ Still 404 |
| 7 | emby_find_providers.py | Enumerate guide provider channel IDs | ✓ Got NJ channel list |
| 8 | emby_test_tuner.py | TunerHosts endpoint exposes channel data | ✗ 404 |
| 9 | SQLite query (direct) | ManagementId lives in the local database | ✓ Breakthrough |
The breakthrough came from stepping outside the API entirely. Emby stores everything in a local SQLite database. One query against library.db returned what the API had been hiding:
Synology SSH — sqlite3
root@DXP8800PLUS:~# sqlite3 /volume1/docker/emby/config/data/library.db \
  "SELECT Name, ExternalId FROM MediaItems WHERE ExternalId LIKE 'm3u_%' ORDER BY Name;"

US: CNN|m3u_4390f9d10da8acd104fd48e5057eb792580c2914d76d210e92e8d1263fd67284_600
US: FOX News|m3u_4390f9d10da8acd104fd48e5057eb792e7767daf3b670f09d112c740cdb44a4b_618
US: HGTV|m3u_4390f9d10da8acd104fd48e5057eb7922be4a920b656e228957aef7ca941ceca_665
US: HBO EAST|m3u_4390f9d10da8acd104fd48e5057eb792cedb30e8bbbc3bebafb45738909beb97_899
... 71 more channels
The ExternalId column in the database is exactly the hash portion of the ManagementId. The full value that Emby’s mapping API expects is just the tuner host ID prepended:
The Key FormulatunerChannelId = {tunerHostId} + _ + ExternalId from library.db
This is not documented anywhere in Emby’s API reference. It only appears in browser dev tools and the local SQLite database.
The Final Script
With all 75 ExternalId values extracted from the database and the full NJ Gracenote channel list obtained from the provider API, the definitive mapper was straightforward to build — two hardcoded dictionaries and a loop of POST requests.
emby_definitive_mapper.py — the one that worked
for ch_name, (prov_id, prov_ch_id) in CHANNEL_MAP.items():
    ext_id  = EXTERNAL_IDS[ch_name]
    mgmt_id = TUNER_PREFIX + ext_id   # the missing piece

    payload = {
        "providerId":        prov_id,
        "tunerChannelId":    mgmt_id,   # ExternalId from SQLite
        "providerChannelId": prov_ch_id, # Gracenote channel ID
    }
    status = api_post("/emby/LiveTv/ChannelMappings", payload)
    if str(status) in ["200", "204"]:
        print(f"  ✓ {ch_name} → {prov_ch_id}")
emby_definitive_mapper.py — output
C:\Users\jjf3\Projects> python emby_definitive_mapper.py

  [NJ   ] US: CNN                        → 10142
  [NJ   ] US: FOX News                   → 16374
  [NJ   ] US: HGTV                       → 49788
  [NJ   ] US: HBO EAST                   → 19548
  [NJ   ] US: History Channel            → 57708
  [NJ   ] US: TNT                        → 42642
  ... 61 more channels
  [XML  ] US: RedBull TV                 → 1035
  [XML  ] US: Law & Crime               → 1055

Done! 75 mapped, 0 failed.
Refresh Guide Data in Emby Dashboard → Live TV.
What This Actually Reveals
The technical problem was interesting. What it revealed about the ecosystem is more interesting.
Gracenote’s data is good because it has to be — it’s the same database that powers cable guide listings, TiVo, Roku, and every smart TV on the market. When Emby calls itself “Emby Guide Data,” it’s reselling Gracenote under its Premiere subscription. The XMLTV feeds that power free EPG sources are scraped, crowdsourced, or pulled from broadcaster APIs — and they show it. Missing cast info, wrong episode numbers, no artwork. The quality gap between Gracenote and the free alternatives is real and visible.
The M3U ecosystem exists in a gray zone adjacent to all of this. The streams are real channels. The channel names don’t conform to any standard. The tvg-id tags are set by whoever packaged the playlist. Matching that chaos to Gracenote’s clean, licensed database requires exactly the kind of manual mapping work that Emby’s UI puts in front of you — or the kind of database surgery this post describes.
Most people running this kind of setup don’t connect all three layers. They get Threadfin working, get some guide data showing up, and stop. The fact that a better guide is sitting right there — accessible, licensed, already paid for through Emby Premiere — and that getting to it requires reading a SQLite database is a genuine gap in the tooling. Nobody had documented the API path. Now someone has.
TL;DR for the technically curiousThe tunerChannelId Emby needs for M3U channel mapping is never exposed by the REST API. It lives in library.db as MediaItems.ExternalId for rows matching LIKE 'm3u_%'. Prepend your tuner host ID and you have everything needed to bulk-map via POST to /emby/LiveTv/ChannelMappings.
The Code
The full scripts — including the Threadfin xepg.db fixer, all nine diagnostic scripts, and the final definitive mapper — are on GitHub along with a technical journey document that covers every dead end in detail.
The mapper as written is hardcoded to my channel lineup and my Emby instance IDs. Adapting it for your setup requires running the SQLite query against your own library.db to extract your channel ExternalId values, and updating the provider IDs and tuner host ID. The README walks through exactly where to find each value.
If you want to see or run the Python script used for this analysis, the full repository is here:
👉 GitHub: