
Why I Built This
I originally thought tracking a TV show’s fandom growth on Reddit would be straightforward.
Count subscribers.
Track users online.
Check back later and see if the numbers went up or down.
That assumption turned out to be wrong.
As I started looking more closely—first casually, then programmatically—it became clear that Reddit no longer exposes fandom size and activity in a way that’s consistent, comparable, or easy to track over time. Subscriber counts, “users online,” and newer UI-only labels often tell different stories depending on where and how you look.
So instead of trying to force unreliable metrics to behave, I built a small tracker to answer a simpler question:
If subscriber numbers are increasingly opaque, how does a fandom actually behave when a show is airing?
The Problem With Traditional Metrics
On the surface, Reddit still appears to show everything you’d want:
- member counts,
- active users,
- large audience numbers framed as community participation.
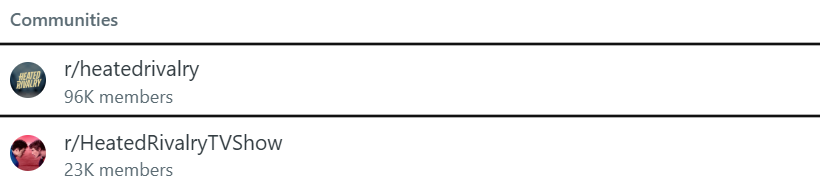
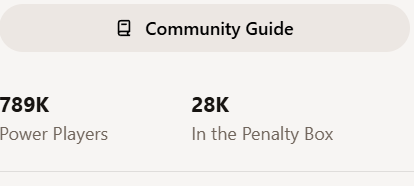
But those numbers are no longer consistent across views. The same subreddit can appear to have wildly different “sizes” depending on whether you’re looking at search results, a community sidebar, or aggregated UI elements that blend multiple related spaces together.
For hobbyist analysts—or anyone trying to track how a TV show grows as it becomes more popular—this creates a real problem:
you can’t rely on subscriber counts alone to measure engagement anymore.
Rather than treating this as a bug to work around, I treated it as a signal that the metric itself had become less useful.
A Different Approach: Comments as Engagement
If membership numbers are increasingly abstracted, discussion isn’t.
People still comment.
They still argue.
They still react in real time to episodes, trailers, and announcements.
So for Heated Rivalry, I built a tracker that focuses on comment activity, not just who clicked “join.”
The idea was simple:
- Identify episode discussion threads.
- Track how their comment counts change over time.
- Separate episode discussions from trailers and general posts.
- Treat comments as a proxy for sustained engagement, not passive interest.
This doesn’t measure “how many people know about the show.”
It measures how many people are actively participating in it.
What the Tracker Looks At
For this first case study, the tracker focuses on posts about Heated Rivalry within broader TV discussion spaces:
- r/television episode discussion threads (e.g.,
1x01,1x02, etc.) - The official trailer post and its discussion
- A small set of other high-engagement posts mentioning the show
For each post, the tracker records:
- comment count,
- post score (net upvotes),
- timestamp,
- and whether it’s episode-related or not.
By running the tracker repeatedly over time, it builds a longitudinal record of how discussion grows—or stalls—after episodes air.
Why Comment Growth Matters
Comments behave differently than votes or subscribers.
- Votes are fast and shallow.
- Subscribers are passive and increasingly obscured.
- Comments require time, attention, and emotional investment.
Episode discussion threads, in particular, are useful because they:
- accumulate comments over days, not minutes,
- reflect both positive and negative reactions,
- and reveal whether conversation sustains beyond initial release.
In practice, this makes comment growth a better indicator of fandom intensity than headline audience numbers.
What This First Pass Shows
The Heated Rivalry tracker is a Python script that queries r/television via Reddit’s public JSON search, tags posts as episode discussions (e.g., 1x01/1x02), an official trailer thread, or other mentions, and then captures each post’s num_comments, score, and permalink into CSV outputs.
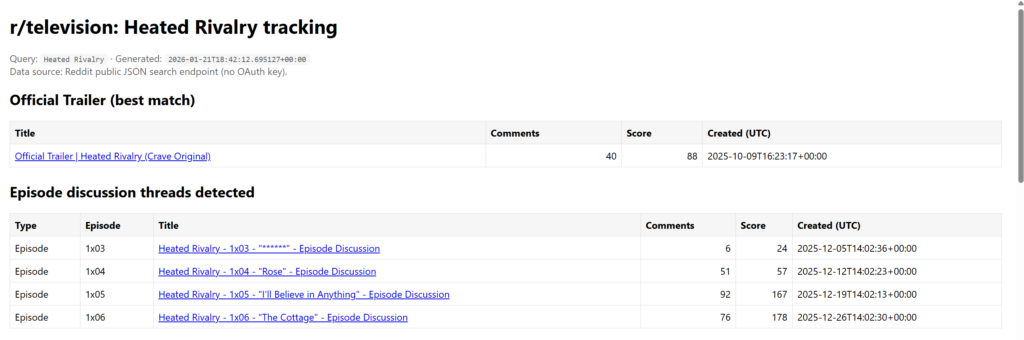
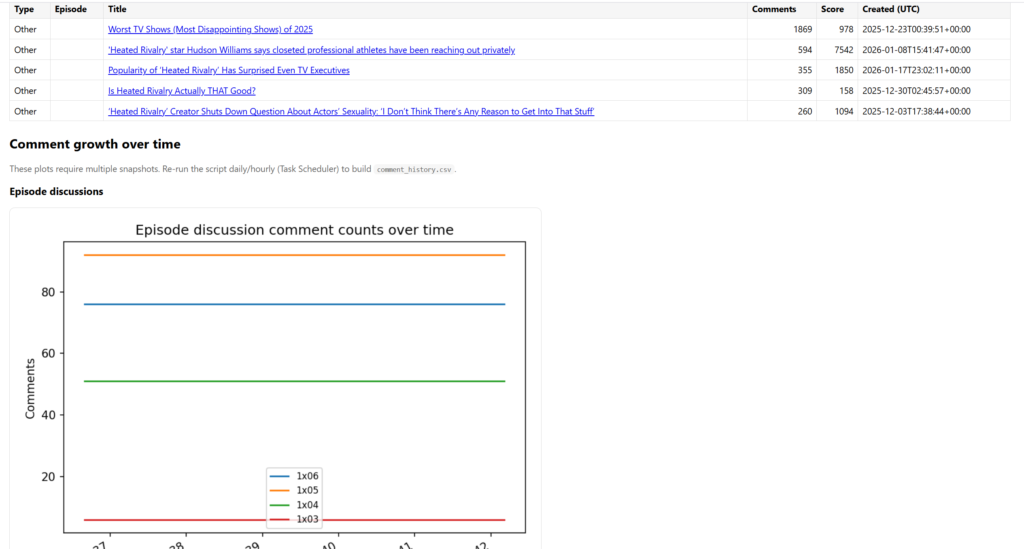
On each run it appends those comment counts into a longitudinal comment_history.csv, so the same threads can be measured repeatedly as they accumulate discussion over time.
In our first pass it successfully separated episode discussion threads from non-episode chatter, identified the trailer thread, and produced a ranked list of a few other high-comment posts for comparison. The resulting plots/dashboard are designed to show whether engagement is concentrated in episode discussions (sustained growth) versus one-off posts (short spikes), using comments as the “true” activity signal rather than inconsistent UI membership numbers.
What Comes Next
This post is Part One of a broader series on measuring fandom response when platforms redefine their metrics.
Next:
- I’ll expand this approach to other shows,
- compare episode-to-episode engagement patterns,
- and apply the same methodology to much larger, more polarized fandoms.
The goal isn’t to rank fandoms.
It’s to understand how they actually behave when love, disappointment, and debate all show up in the same comment thread.
If you want to see or run the Python script used for this analysis, the full repository is here:
👉 GitHub: https://github.com/jjf3/rewindos_heated_rivalry_tracker
Leave a Reply